Dashboards and BI panels that turn scattered information into clear decisions, in real time.
You have data in five different places: ERP, spreadsheets, CRM, emails. Your team loses hours gathering information to prepare a report that's already outdated by the time it reaches management.
Decisions get made on gut feeling because there's no single source of truth. You know the data is there, but nobody turns it into useful information.
Dashboards that consolidate your data in one place. Clear panels, automatically updated, designed so each person sees exactly what they need to decide.
ERP, CRM, databases, APIs, spreadsheets. All connected in a single panel, without duplicating data.
The indicators that actually matter to your business, not generic metrics. Every number has a purpose and a tied action.
Data refreshes automatically. No manual reports, no waiting for month-end to see how the business is doing.
From the office computer, a tablet on the shop floor or a phone in a meeting. Your data is always accessible.
If a KPI drifts out of range, you get notified. You don't have to stare at the panel to catch problems.
Leadership sees the executive summary. Operations sees the detail. Each person sees what they need, without noise.
A dashboard that centralizes sales, operations and finance in a single place. Data refreshes in real time and each department accesses the view it needs.
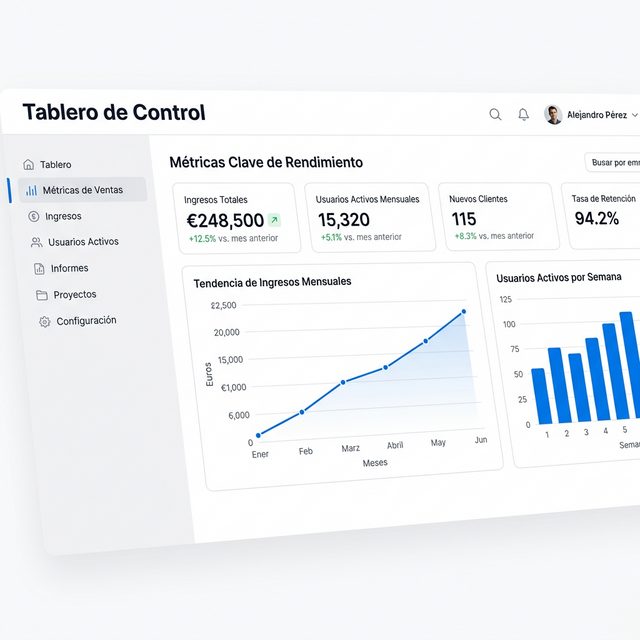
Working example based on a real case. Data shown is fictional.
Seeing a dashboard live is the best way to understand its value. Here you'll get access to an interactive example with test data.
Explore a working dashboard with KPIs, interactive charts, time-range filters and an AI assistant. The data is fictional, the experience is real.
What companies achieve when they move from manual reports to a centralized dashboard.
Time spent preparing manual reports
To access information that used to take hours
Business visibility for management, no middlemen
Decisions based on real data, not hunches. Reports that write themselves. And a team that stops wasting time gathering information and starts analyzing it.
Pick the level of complexity you need. If you're unsure, I'll help you figure it out.
One-time pricing. Hosting is optional and billed separately (from €10/month depending on load), or you can deploy on your own infrastructure. Usage of third-party services (paid APIs, cloud databases) isn't included either if your case needs them: they're billed directly to the client.
If Power BI or Excel cover what you need, great. But if your team still loses hours consolidating data from different sources, the problem isn't the tool — it's the integration. A custom dashboard connects directly to your systems and gives you the answer without intermediate steps.
That's exactly why it's valuable. If your data were all in one place, you wouldn't need a dashboard. Connecting different sources is exactly what I do. We start with the 2-3 most important sources and grow from there.
A good dashboard doesn't need training. If your team can read a chart and click a filter, they can use the panel. I design it thinking about the person who will use it every day, not a technical profile.
The dashboard adapts to you, not the other way around. Adding a new KPI, changing a chart or connecting an extra source are normal tweaks that don't require rebuilding anything from scratch.
Tell me where your data lives today and what decisions you need to make. I'll tell you how a dashboard can help and what the process would look like.
Let's talk about your project